Knight Frank, the independent global property consultancy, and BOCI jointly hosted a press conference in Hong Kong for the launch of The Wealth Report 2015. Now in its ninth year, the report tracks the growing super-rich population in 108 cities across 97 countries.
• Asia sees highest growth rate in super-rich populations in 2014 (page 2)
• Out of the 15 locations with UHNWI population growth of 5% or above in 2014, six are in Asia, including Hong Kong (page 3)
• Asia holds four of the top 10 places of the most important cities to the world’s UHNWIs (page 12)
• China’s UHNWI population will overtake Germany and the UK in 2024 (page 3)
• In 10 years’ time, China will account for the largest increment in the world’s billionaires population by adding 154 billionaires (page 4)
• According to Knight Frank’s Attitude Survey, 94% of Hong Kong wealth advisors expect their clients’ net worth to increase in 2015, the most bullish about prospects in 2015 (page 6)
• China and Hong Kong UHNWIs own the most number of homes at 4.7 and 4.6 respectively (page 7)
• Hong Kong’s luxury residential prices remain the second highest in the world, following Monaco (Page 10)
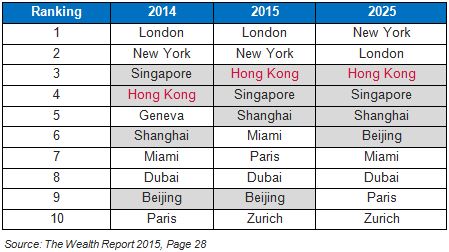
• Hong Kong overtakes Singapore moving to third position in the world’s most important cities to UHNWIs in 2015, topping the list in Asia (page 13)
Wealth
Wealth Distribution
Source: The Wealth Report 2015, Pages 17-22
In 2014, around 15 people a day joined the ranks of the ultra-wealthy, or those with a net worth of US$30m or more. This growth is set to continue in the coming decade, with the global population of ultra-high-net-worth individuals (UHNWIs) forecast to climb by 34% to a total of almost 231,000.
Rise in Wealth Population in Asia
Around the world in 2014, Asia saw the largest rise in its wealth population compared to other regions across all wealth brackets:
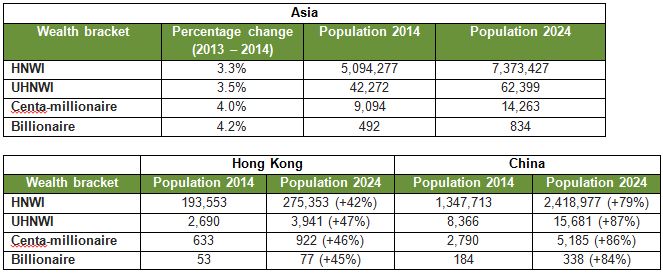
Most notably on a regional level, Asia overtook North America as the region with the second-largest increase in UHNWIs in 2014. Some 1,419 people moved past the $30m+ mark in Asia in 2014, after an increase of fewer than 1,000 in 2013. Europe held onto the top spot with the most new entrants into the ultra-wealthy bracket over 2014. “The wealthy population in Hong Kong is expected to grow by more than 40% from 2014 to 2024, while that in China could jump over 80% during the period”, says David Ji, Director and Head of Research & Consultancy, Greater China at Knight Frank.
The ultra-wealthy in Asia now also hold more in total wealth with net assets of $5.9tn – 7% more than those in North America with $5.5tn. However, with a $6.4tn treasure chest, European UHNWIs still control the most wealth. By 2024, Asia will overtake North America in UHNWI population by 11%.
Nicholas Holt, Head of Research for Asia Pacific, says, “The rise of Asia and its subsequent impact on prime property within the region and beyond has been one of the key narratives highlighted in The Wealth Report. This growth in wealth is certainly impacting prime residential markets across Asia and Australasia, with the region’s key cities and second home destinations seeing strong price growth over the last five years. This is despite interventions by policy makers in a number of markets, designed to slow price growth and curb foreign ownership.
“Over the past nine years, the investors hunger for knowledge has only increased, especially from our clients here in Asia Pacific, where UHNW property investors are becoming increasingly confident and are looking to diversify their property portfolios by exploring new asset classes and locations.”
UHNWI population: (defined as those with a net worth of US$30m or more)
• Out of the 15 locations with UHNWI population growth of 5% or above in 2014, six are in Asia (including Central Asia).
Locations with UHNWI population growth of 5% or above in 2014

• 10 years from now, in terms of absolute number of UHNWIs, China (2014 ranking: 5th position) will overtake Germany (2014 ranking: 3rd position) and the UK (2014 ranking: 4th position)
• ”Between 2014-2024, Hong Kong is expected to see 1,251 new UHNWI residents, to rank the second for cities with the greatest growth in the number of UHNWIs”, according to David Ji.
UHNWI population growth 2014-2024
Billionaire population:
• The total number of billionaires in the world now reaches 1,844, which is an 82% increase from ten years ago. Hong Kong, with 53 billionaires, tops the largest billionaire population in Asia.
• In terms of absolute number of billionaires, China is currently behind the USA in second position. In 10 years’ time, China will account for the largest increment in the world billionaires’ population by adding 154 billionaires.
• As of 2014 in terms of absolute number of billionaires, 10 of the top 20 cities in the world are in Asia.
Billionaire population in 2014
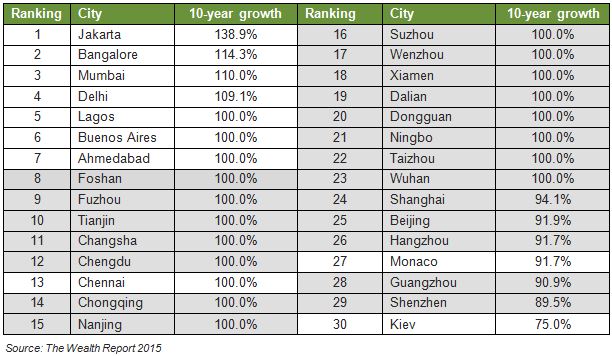
• Over the next 10 years, Chinese cities will comprise two-thirds of the top 30 cities, in terms of the percentage growth in billionaires.
Billionaire population growth 2014-2024
Attitudes
Attitude Survey
Source: The Wealth Report 2015, Pages 9-13
The annual Attitudes Survey in the report is based on a detailed survey of almost 500 leading private bankers and wealth advisors from across the globe, and reflects the attitudes of their ultra-wealthy clients who have a combined wealth of over US$1.7tn. With contributors from all parts of the world, the results of the Attitudes Survey highlight some revealing regional trends regarding investment risks and opportunities among the super-rich.
Wealth trends
• 80% of wealth advisors expect their clients’ net worth to increase in 2015; Hong Kong’s ultra-rich, at 94%, is the most bullish about prospects in 2015.
Wealth threats
• Globally, family succession issues were the number one worry, with 85% of respondents saying their clients were concerned about the handover of family wealth to the next generation. However, for China and Hong Kong, political interference stood out as the number one concern.
UHNWI attitudes toward……
I. Philanthropy, shopping, flying:
o When asked if younger UHNWIs spent more on luxury goods, two-thirds of the respondents agreed that that was the case, perhaps explaining why succession planning is considered such a big issue. However, Japan (33%) and the markets in Greater China including China (37%), Hong Kong (24%) and Taiwan (32%) were far below the global average.
II. Education: Seeking out the best education abroad for their children is clearly very important for UHNWIs from China, Hong Kong and Malaysia with 67%, 70% and 72% respectively expected to send their children overseas for a university education.
III. Property investment:
o Property is increasingly seen as a mainstream investment class, accounting on average for 38% of an Asian UHNWI’s investment portfolios.
o Globally, 37% of survey respondents said their clients increased their exposure to property as an investment in 2014 and 35% expect that trend to continue in 2015. In Asia, 22% of survey respondents said their clients increased their exposure to property as an investment in 2014; and 27% expect that trend to continue in 2015.
o Residential property is the most popular sector to invest in, with 84% of wealth advisors in Asia saying their clients were becoming more interested in it. Offices (68%) were the next most popular property type for Asian investors.
o An astounding 92% of wealth advisors in Australia and India said that their clients will most likely invest in property within their own countries. This sentiment was echoed throughout most parts of Asia, except in Hong Kong where wealth advisors said 65% of the super-rich prefer investing abroad.
IV. Prime residential property: On average, China and Hong Kong UHNWIs own the most number of homes at 4.7 and 4.6 respectively, compared to the global average of three homes.
Property
Prime International Residential Index (PIRI)
Source: The Wealth Report 2015, P35
This year, the PIRI included performance data for 100 of the world’s key luxury cities and second-home markets, up from last year’s 90. The US dominates the top end of the rankings in terms of price growth with four cities in the top 10. By contrast, Asia which had four top 10 markets in last year’s rankings, now only has Bali as the solitary regional representative in third place.
Overall PIRI performance:
• The value of luxury residential property around the world rose by just over 2% on average in 2014. With reversals in markets in Asia, the Middle East and Europe, growth was lower than the 2.8% seen in 2013.
• While 16 of the locations in PIRI 100 saw double-digit prime property price growth in 2014, the value of luxury homes fell or remained static in almost 40% of them.
• Beijing and Guangzhou, previously on the top 10 list, have now slipped to the middle of the chart. Singapore also slipped in 2014 towards the bottom of PIRI 100 rankings.
Nicholas Holt says, “Asian growth has moderated for a variety of reasons. Macro-prudential tools, introduced to cool residential markets, continue to have an impact. This is evident most notably in the markets with on-going weak growth such as Hong Kong and Singapore. Government policy has been deliberately aimed at limiting price rises through higher taxation and mortgage market intervention. China, on the other hand, has been facing a slowdown in its residential markets throughout 2014, although the Tier-1 cities have proved more resilient to price declines. Despite the slowdown in Asia, the performance of prime property in Indonesia over the last few years – most notably in Jakarta and Bali – underlines just how far Southeast Asia has come as a region.
Pater Pak, Executive Director and Head of Trading Department, BOCI Securities Limited says, “After 30 years of rapid expansion, China’s economy is moving into the ‘new normal’ phase with slowing growth, gear-shifting and restructuring. With the property market entering into the cyclical plus structural downturn, there is a persisting downside pressure for 2015 China economy. Overseas demand recovery should somewhat help exports, China’s manufacturing still face tremendous pressure of overcapacity, deflation and earning drops. The potential economic growth will rely on the boost in human capital development and innovation. This requires China to accelerate the reform in both financial system and public services.
The ‘One Belt One Road’ strategy will facilitate economic and trade integration between China and related countries and help domestic enterprises for more equipment exports and overseas construction projects in future.”
Australasia – Demand from Asian buyers remain strong
In Australasia, investors saw strong prime property returns in 2014, with the PIRI 100 index showing 12.1%, 11.0% and 8.5% annual price growth in Auckland, Sydney and Melbourne respectively.
“Demand from Asian buyers for properties in Australia and New Zealand remains strong, Wealthy Chinese investors have been dominant,” adds Nicholas Holt. The world’s largest residential developers, led by players from China, India, Hong Kong and Malaysia, continue to diversify into new markets. Where Greenland Group, Swire, China Vanke Co and Lodha Group lead, they are followed by private compatriot investors looking to dip their toe into international investment.
The PIRI 100
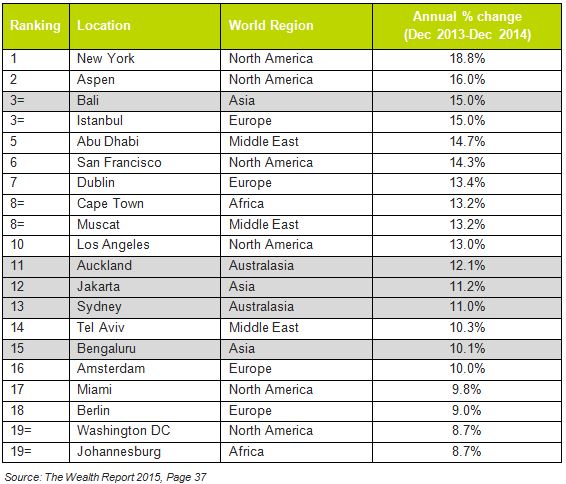
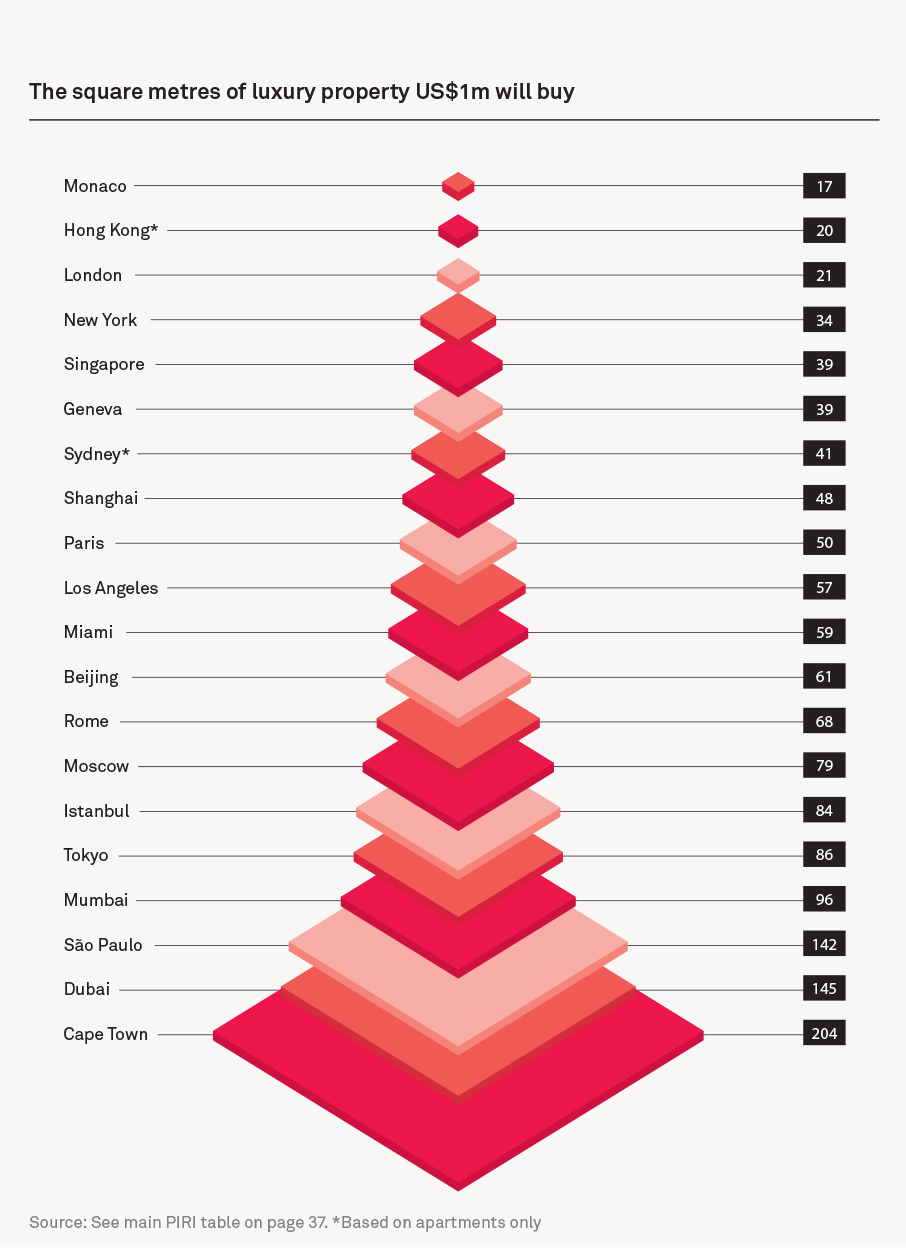
Hong Kong’s luxury homes remain the second most expensive in the world
Monaco - for the eighth consecutive year – is confirmed as the most expensive city to buy luxury residential property, with US$1m buying just 17 square metres of accommodation. Not far behind, are Hong Kong and London occupying second and third. US$1m would buy 20 and 21 square metres, respectively.
Source: The Wealth Report 2015, Page 39
Trend: HNWI migration – a major influence on global luxury property market
• The biggest story in terms of wealth-exporting nations is undoubtedly China. It is estimated that 76,200 Chinese millionaires emigrated or acquired alternative citizenship over the past 10 years to 2013. They are a significant force in Europe, and dominate Asia-Pacific schemes – with around 90% of applicants for Australia’s Significant Investor visas coming from China.
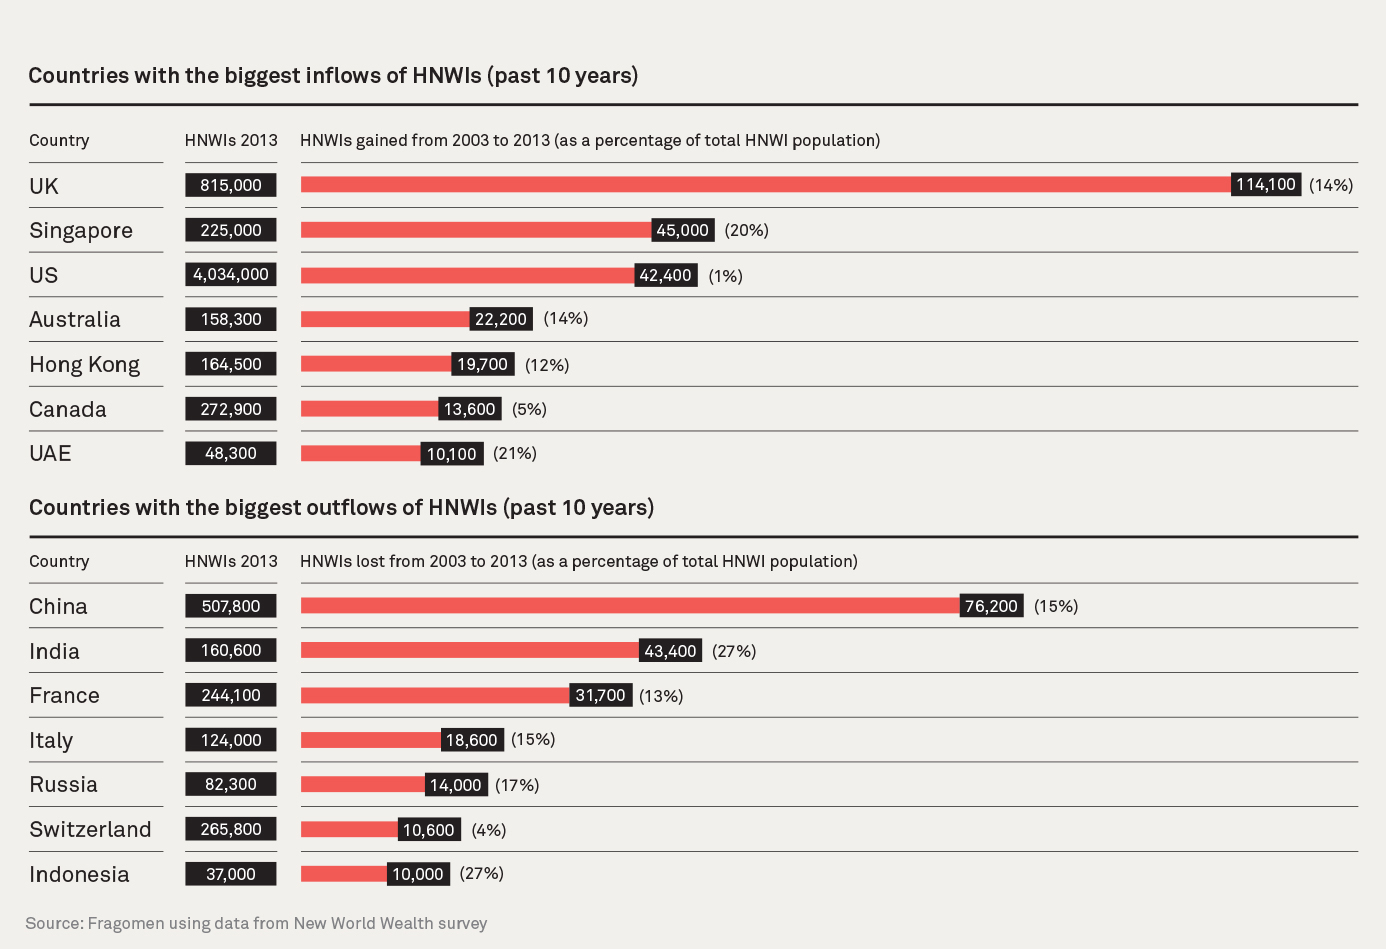
• The increasing impact of migrating Chinese HNWIs continues to influence prime residential markets around the world. In the first nine months of 2014, 44% of applicants for the UK’s Tier-1 investment visas were from China, leading to a rise in the number of Chinese buyers of prime London property.
Cities
A quarter of commercial transactions funded by private investors
• Private investors accounted for around a quarter of all commercial property deals in 2014. In 2015 we expect to see more private money in the value-add asset market. Many of these transactions, while essentially funded by an UHNWI, are fronted by a family-owned fund, company or private office.

• One of the clear trends to emerge from the survey results is the increasingly global nature of private investments. While UHNWIs still hold most of their property investments in their own country, in the vast majority of the locations surveyed, wealthy private individuals have been increasing the amount invested overseas.
• UHNWIs are now looking beyond prime or trophy offices and retail space as a safe haven for their funds; they are prepared to look up the risk curve to non-core locations. This may mean moving outside a capital city’s CBD area, where yields have become increasingly compressed, or heading into secondary cities where better values and higher returns are available. Increasingly for many UHNWIs, it also means investing overseas.
• Nicholas Holt says, “In terms of the cities that are consistently favoured by UHNWIs, Asian cities now make up four of the top 10 slots in Knight Frank’s Global Cities Survey. The most intriguing battle remains between the region’s top two cities, as Hong Kong retakes third spot from Singapore in this year’s survey. Strengthened by its connections with mainland China and the sheer weight of Chinese capital on its doorstep, Hong Kong boasts a larger billionaire population than its Southeast Asian rival.
• On Chinese investors, David Ji says, “After several initial waves of Chinese institutional capital outflow, Chinese UHNWIs are becoming part of the so-called Fourth Wave of investors, which also consists of insurance companies, small- to mid-cap state-owned enterprises and private developers. After heavy investment into gateway cities and trophy buildings, Chinese UHNWIs have established a familiarity with transacting in these markets, and we expect them to start pursuing higher yields in other commercial property sectors and move beyond the gateway cities of London, New York and Sydney.
Knight Frank Global Cities Survey - Top 10 most important cities to UHNWIs
Notes to editors:
• Centa-millionaires: Defined as someone with a net worth of US$100m or more, excluding their principal residence.
• UHNWI: Defined as someone with a net worth of US$30m or more, excluding their principal residence.
• HNWI: Defined as someone with a net worth of US$1m or more, excluding their principal residence.
To download the report, please visit: